This portion of the Intelligent Action Series walks through our Brewery Benchmarks Assessment process, step-by-step.
Step 1: Context & Endgame
Step 2: Financial Analysis
Step 3: Taproom, Distribution & Operations
Step 4: The Annual Goals
Step 5: Leadership & Vision
If you believe an assessment is the right move for your brewery this year, reach out and schedule a call to discuss your brewery’s current situation and how we can help.
One of my pet peeves in the consulting world…
Is the tendency of analysts to build “spreadsheets to nowhere.”
That is…
Analysis that gets us no closer to the actual objective.
Step 3: Taproom, Distribution, and Operations Analysis
Which is why in Step 3 our intent is to break down the high-level financial targets we established yesterday into the specific tactical actions needed to get the brewery to the targets we’ve identified during Financial Analysis.
This comes in three flavors: taproom, distribution, and operations.
First: The Taproom
If you recall from our example from the previous post, the initial success of Hypothetical Brewery was built on the back of a hot start, largely driven by the taproom.
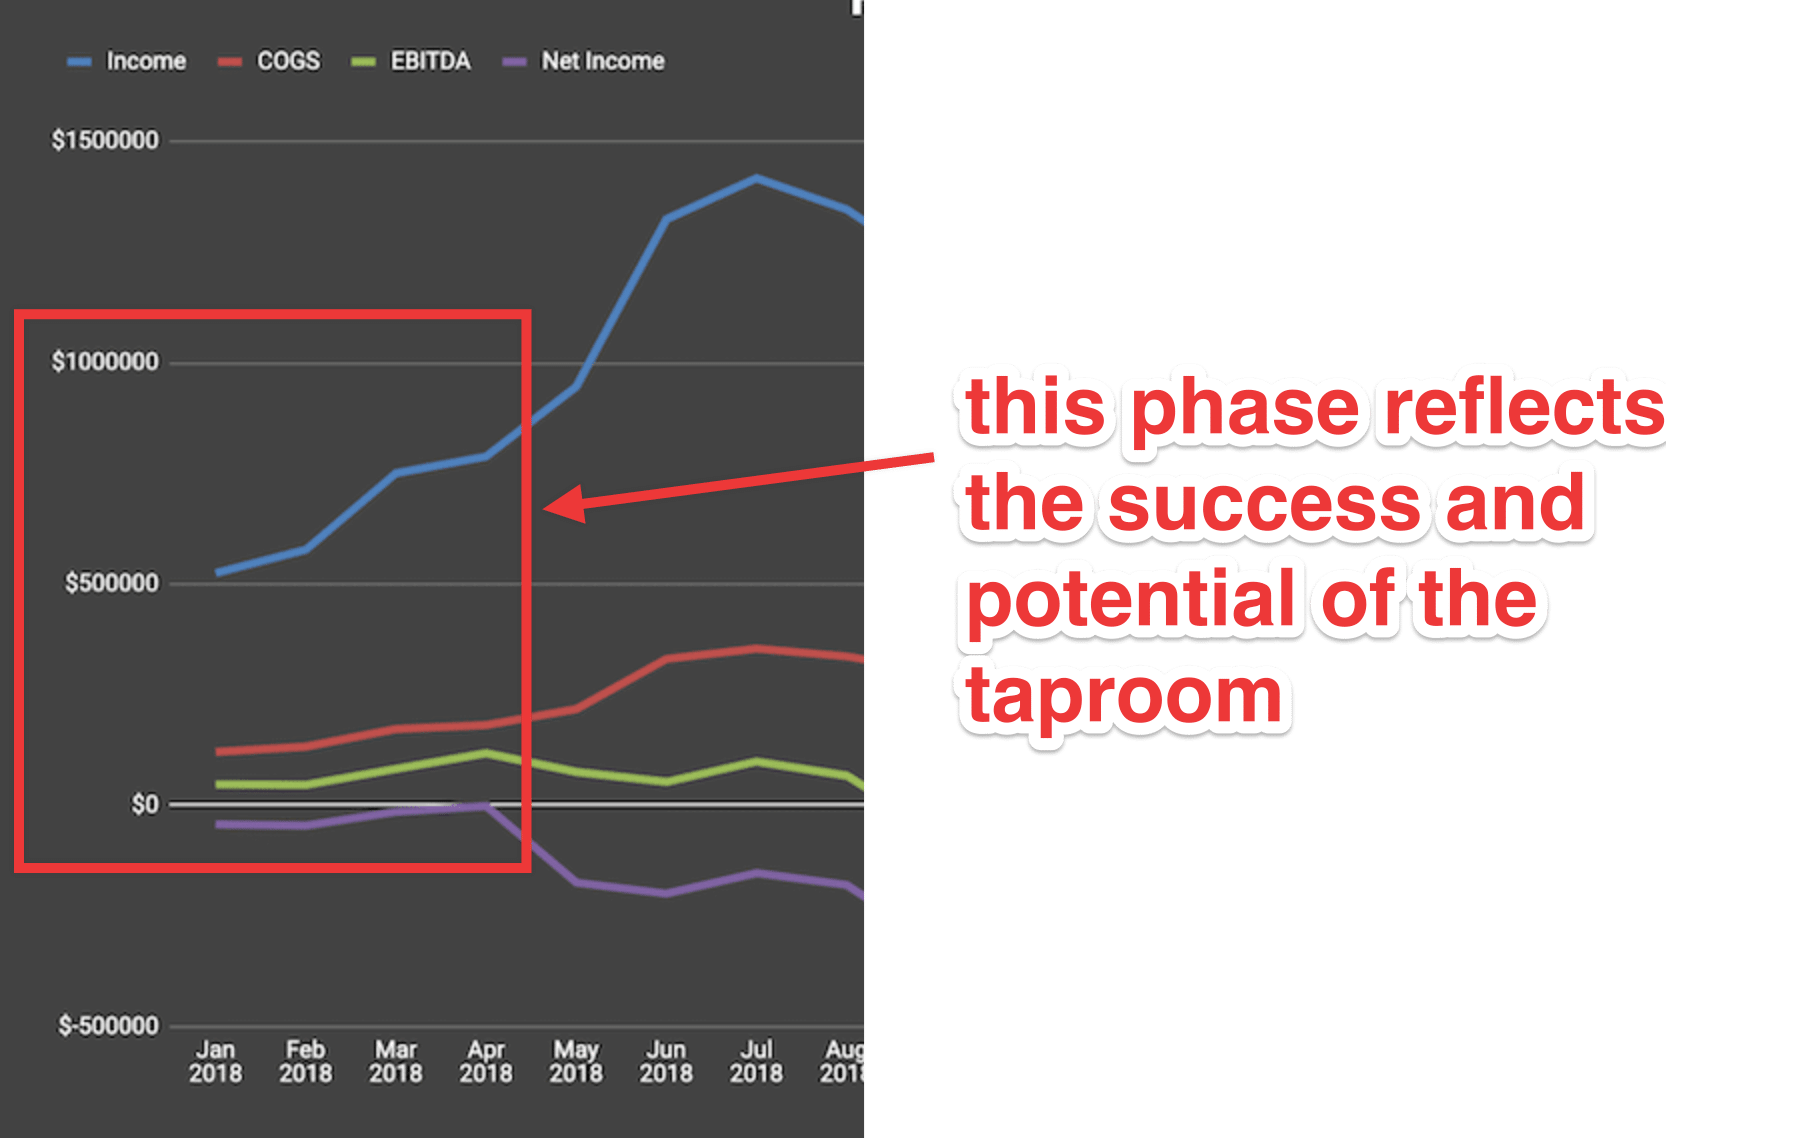
It drove the profits needed to give the ownership the confidence to invest in expansion. And that’s reflected in the output of the Taproom Analysis portion of the Brewery Benchmarks Assessment.
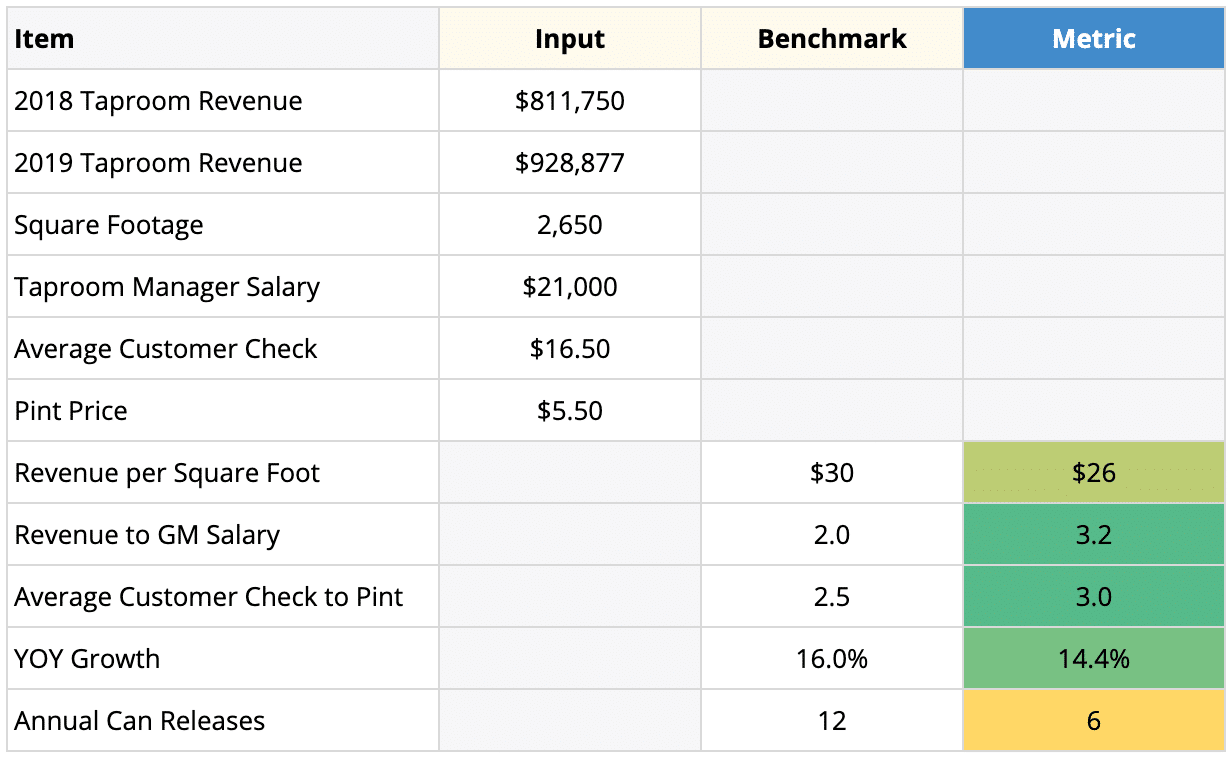
If you’ve been following along with us, you’ll recognize much of this from our Taproom Pro Tips, this time brought to life through direct comparison against the previous year’s performance.
Based on what we’ve gathered here…
- Revenue per Square Foot is still slightly below our benchmark. There’s room for additional growth.
- Revenue to GM Salary, in their case, reflects part-time labor and with a push to drive additional taproom sales, should be brought down as they bring on a full time Taproom Manager.
- Average Customer Check to Pint is in good shape, indicating an appropriate level of per-patron average order value to support marketing efforts to drive more traffic.
- YOY Growth has been healthy, and indicates there is evidence of growth the team can find confidence in.
- Annual Can Releases should become a driver of additional traffic and revenue. This is a direct impact lever to pull.
- And additional recommendations that come out of the specifics of the review discussion.
We can send the Hypothetical team away with an action items list they can start applying in the taproom as fast as they’re willing to move.
Second: Distribution
Here’s where things get juicy for the Hypothetical team.
Their inability to get their distribution effort up and running effectively has been the single biggest contributor to their downturn in profits and plateau in revenue.
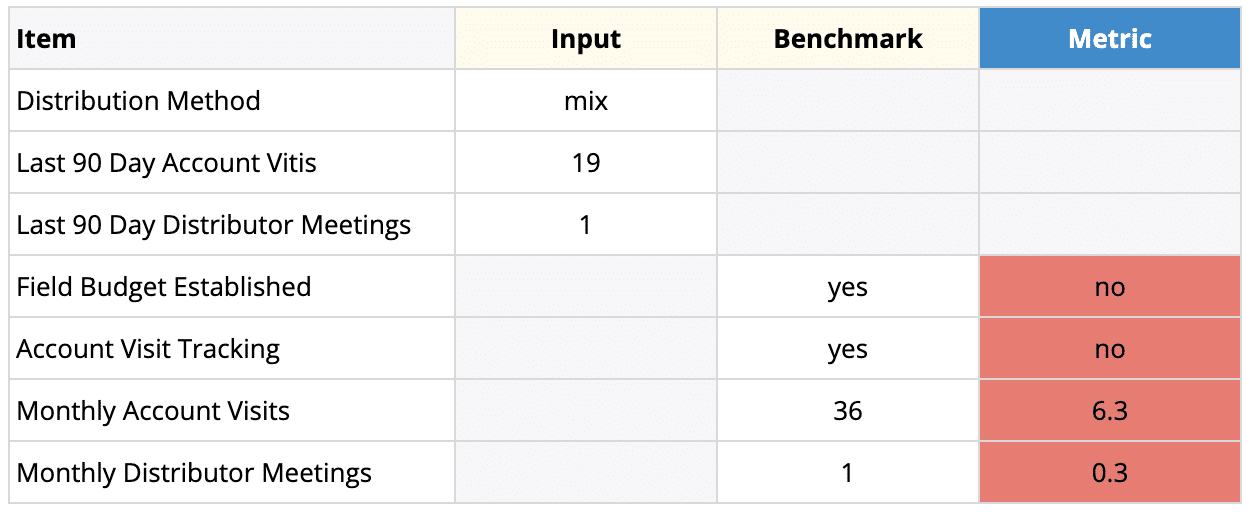
Again we see a callback here to the Sales Pro Tips. (When we said we were giving away our best stuff, we weren’t lyin’ folks.)
There’s some serious work to be done here.
Suffice it to say in a scenario like this we’re going deep into specific recommendations:
- Analyzing distribution Revenue per Barrel and profitability.
- Developing a distribution channel entry strategy.
- Restructuring their rep compensation.
- Establishing the foundational elements of an effective weekly sales team cadence (visits, the weekly sales meeting, tracking, budget, lessons learned).
And finally, to support the revenue increases and profitability improvements required in these two areas…
Third: Operations
Here we take a look at the capacity, tools, team, and processes the brewery has in place in order to support the production volume they need to sell through.
Hypothetical Brewery has a few issues to resolve in this area, as identified yesterday. They need to…
- Grow production volume to support and increase sales across the board.
- Do that while maintaining the same level of production labor, and utilize their resources more efficiently.
- Address the creeping increase in COGS.
And during the Operations Analysis portion we’ll establish:
- What changes are needed to the roles and responsibilities of the production staff? Who is accountable for what?What processes have been put in place? And is the extra labor actually needed (or just going to non-value-added activities)?
- Ekos usage and execution. Here’s where the magic happens with respect to COGS reduction. Are they utilizing the raw materials forecasting function? Are they analyzing cost per SKU? From this information we can establish an action plan to replace unnecessarily cost-heavy ingredients and/or purchase ahead to avoid the “last-minute order” tax. They can also feed that information back to the sales team to ensure they’re pushing product out the door with enough margin to keep us from digging themselves into a hole.
- Production targets. What % increase in utilization and production volume is necessary to meet the annual goals we’ll establish? And how is this information being passed down and reinforced with the team?
Speaking of goals, what happens if they take action on these initiatives?
That’s where the Annual Goals come into play.
And we’ll cover these next.