This portion of the Intelligent Action Series walks through our Brewery Benchmarks Assessment process, step-by-step.
Step 1: Context & Endgame
Step 2: Financial Analysis
Step 3: Taproom, Distribution & Operations
Step 4: The Annual Goals
Step 5: Leadership & Vision
If you believe an assessment is the right move for your brewery this year, reach out and schedule a call to discuss your brewery’s current situation and how we can help.
Hypothetical Brewery LLC came to us with a problem.
After a hot start to 2018, they’ve since hit a bit of a plateau – some growing pains with an expansion in capacity and a push into distribution.
While they’ve made some headway, they’re looking for financial clarity on which next steps they should take to get back on their 2018 growth curve and turn around their dip in profitability.
This example represents just one of a whole slew of decision-making scenarios the Benchmarks Assessment process is designed to unpack.
Step 2: Financial Analysis
And so what we want to understand with the Financial Analysis portion of the assessment is where the brewery stands with respect to the context and endgame we’ve established in Step 1, and also the financial benchmarks that we’ve established based on our industry data set and experience.
The first piece of the puzzle is the Rolling 12 analysis.
The Rolling 12
The Rolling 12 represents a rolling average of the prior 12 months reported monthly (e.g. Jan 2019 represents the average value of Feb 2018 – Jan 2019).
This smooths the bumps and bruises that may otherwise muddy the waters for interpretation. While blowout months are great, they make objective analysis difficult. Also, without the 12-month average, large annual purchases throw your numbers out of whack.
The Rolling 12 is designed to look past the variation and identify what the financial trajectory of the brewery tells us about the impact of the decisions the leadership team has made along the way. It’s the entry point into our fact-finding mission.
Let’s take a look at our example brewery’s Rolling 12.
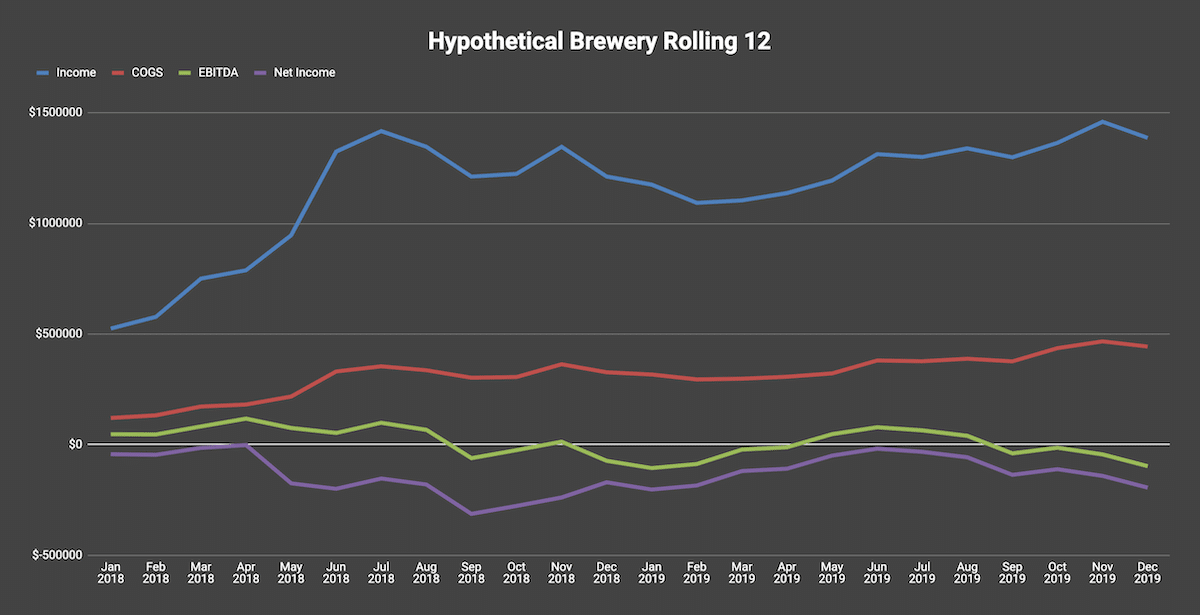
For Hypothetical Brewery, we can see a few different trends emerging:
- Because there is a large, consistent gap between income and COGS, we know that (a) the gross margin is at least reasonable, and (b) they’re probably mapping costs and utilizing Ekos appropriately. We’ll be able to extract some good data here.
- Starting in January of 2018 they’re off to a hot start. We see a steep increase in revenue up until the summer of 2018 at which point it starts to level off. In line with the revenue growth spurt, we see a decline in EBITDA, a dip in net income, and an increase in COGS as a percentage of revenue.
- From the Context gathered in Step 1, this period corresponds with the brewery’s first significant expansion effort beyond their initial 3 BBL system. These are all telltale signs of expansion investment and distribution push. The brewery then spends the next 12 months struggling to manage the growth push. EBITDA continues to dip in line with the smaller distribution margins. Revenue levels off without the sales infrastructure to make headway into new channels.
We’ve got the big picture diagnosis:
They made an early distro push they weren’t prepared for and have spent the past 18 months in reactionary catch-up mode.
Now let’s dig deeper and identify the actions they can start to take to get back to the growth curve from early 2018.
The Financial Metrics
The metrics benchmarking process takes place across the key P&L line items that drive profitability and growth based on the revenue split categories we’ve developed.
This is what the output looks like for Hypothetical Brewery.
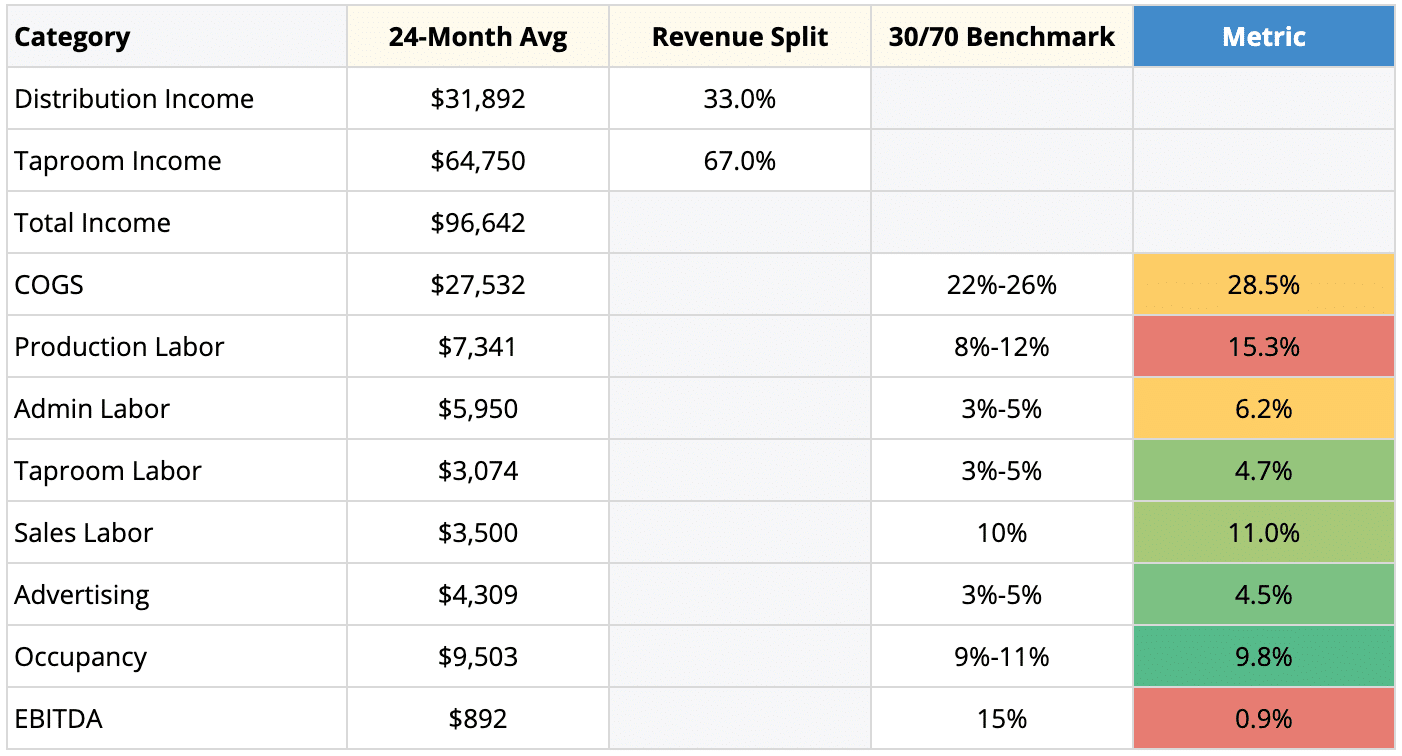
First off, they fall into the 30% distribution, 70% taproom category. Pulling from our benchmarks for 30/70, we start to see where they’re in and out of range:
- COGS is bloated. This makes sense given the rapid increase in volume, which didn’t leave time for analyzing ingredients and negotiating cost. They just needed to get material in the door as fast as possible and then haven’t gone back to the drawing board on those purchases. An initial area of focus is to go back to materials, identify areas to cut cost, and bring COGS into range.
- Taproom Labor is in range, Production Labor is too high. The brewery has hired some additional production staff to manage the expanded demand, but they’re not being utilized efficiently. As the sales and taproom teams push to sell more beer, the production team needs to implement process and significantly increase output with the same labor.
- Sales Labor is in range but misaligned. While the total expenditure hits the target, the compensation structure for the reps (one F/T, one P/T) is base-only without a strong tie to C/E targets with a commission structure. Hence the plateau in distribution sales. Their sales comp needs an overhaul to place additional focus on driving results.
- Advertising and Occupancy are in range. Maintain these spending ranges. No changes needed here.
- EBITDA is getting eaten up. In addition to the COGS and labor over-expenditures, additional cavalier spending has contributed to the EBITDA decline. This trend creates significant risk for the brewery, and puts a strain on the ability to continue to invest in the marketing and sales labor necessary to grow revenue. Cost controls are needed to reign in the spending.
The moral of the story here:
The brewery needs to get costs under control that have run up during this expansion push.
They need to utilize their production labor more efficiently and get their sales reps driving results.
Finally, they need to take full advantage of the new capacity that they’ve obtained and maintain their profitability moving forward.
Your next question is:
Great, but how do we actually DO THIS?
As in, those are some nice charts and tables you’ve got there…
But we live in the real world, and making the types changes you’re suggesting is no small feat.
We’ve got you.
The next three legs of the Brewery Benchmarks Assessment are aimed at producing the specific actions the brewery needs to take where the rubber meets the road.
We’ll cover those in Step 3.
For now, if this level of financial clarity could be the difference maker for your brewery, I encourage you to reach out and engage us to run this analysis for you.
Click here to schedule a call with our team.