Happy New Year, friends.
Today was supposed to be my annual “Crystal Ball” email, but I called an audible. Who cares what’s in my crystal ball? Because when I looked back at my notes for what’s in my crystal ball for 2025, one word was missing: profit.
To kick off 2025, we’re going Back to Basics—starting with your numbers and the foundation of profit: accounting.
I’ll begin with a very controversial statement:
Your financials mean absolutely nothing to you.
Let me explain. You likely have a bookkeeper, a local accountant, or someone on staff handling your accounting. Meanwhile, you’re biting your nails, checking your bank balance, tracking daily sales, and wondering how to cover the next round of bills.
Am I right?
In 2025, it’s time for your numbers to make sense and help you make decisions. To guide you, we’re launching a three-part series on the basic functions of financial statements and how they can serve you.
Welcome to Back to Basics.

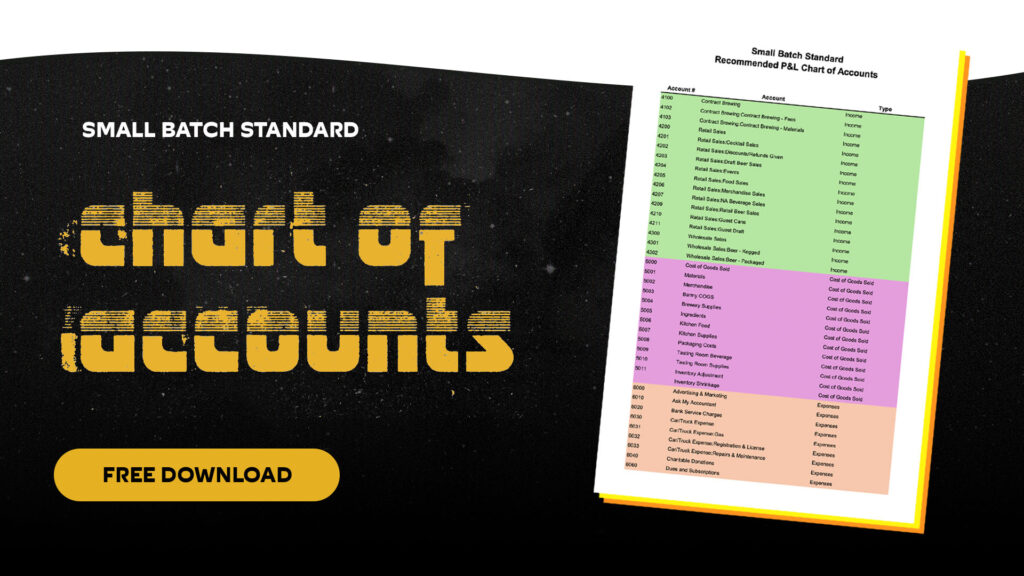
For today, let’s focus on your Profit and Loss setup—specifically, the Chart of Accounts.
Your P&L Chart of Accounts should have three main sections: Revenue, Cost of Goods Sold, Expenses.
Let’s break them down.
- This is money coming in from wholesale or retail sales.
- Wholesale should break down into sales by package type (e.g., kegs).
- Retail should include categories like draft beer, events, non-alcoholic beverages, food, merchandise, and beer to-go.
- COGS represents the cost of what was sold in the period.
- This includes the cost to produce kegs, cases, and taproom beer, excise taxes, and any necessary inventory adjustments.
- A quick note: Someone recently suggested I include labor and utilities in COGS. While this might work for other industries, brewing isn’t like other manufacturing businesses. We have better ways to track those costs.
- Everything else—labor, advertising, keg leasing, utilities, etc.—goes here.
- This setup ensures you can measure and benchmark performance effectively.
To recap:
Your financials should mean something to you.
That starts with properly setting up your Chart of Accounts.
Down below, you’ll find a sample Chart of Accounts. Download it, adapt it to your system, and start making your financials work for you.
Next week, we’ll dive into labor—how we track it and why we break it out the way we do.
Until then, take care and reach out with any questions.
-cf